在按照Jerry的公众号文章 什么?在SAP中国研究院里还需要会PHP开发? 进行XDebug在本地的配置之后,如果想使用Visual Studio Code而不是Eclipse来调试PHP应用,步骤也比较简单。
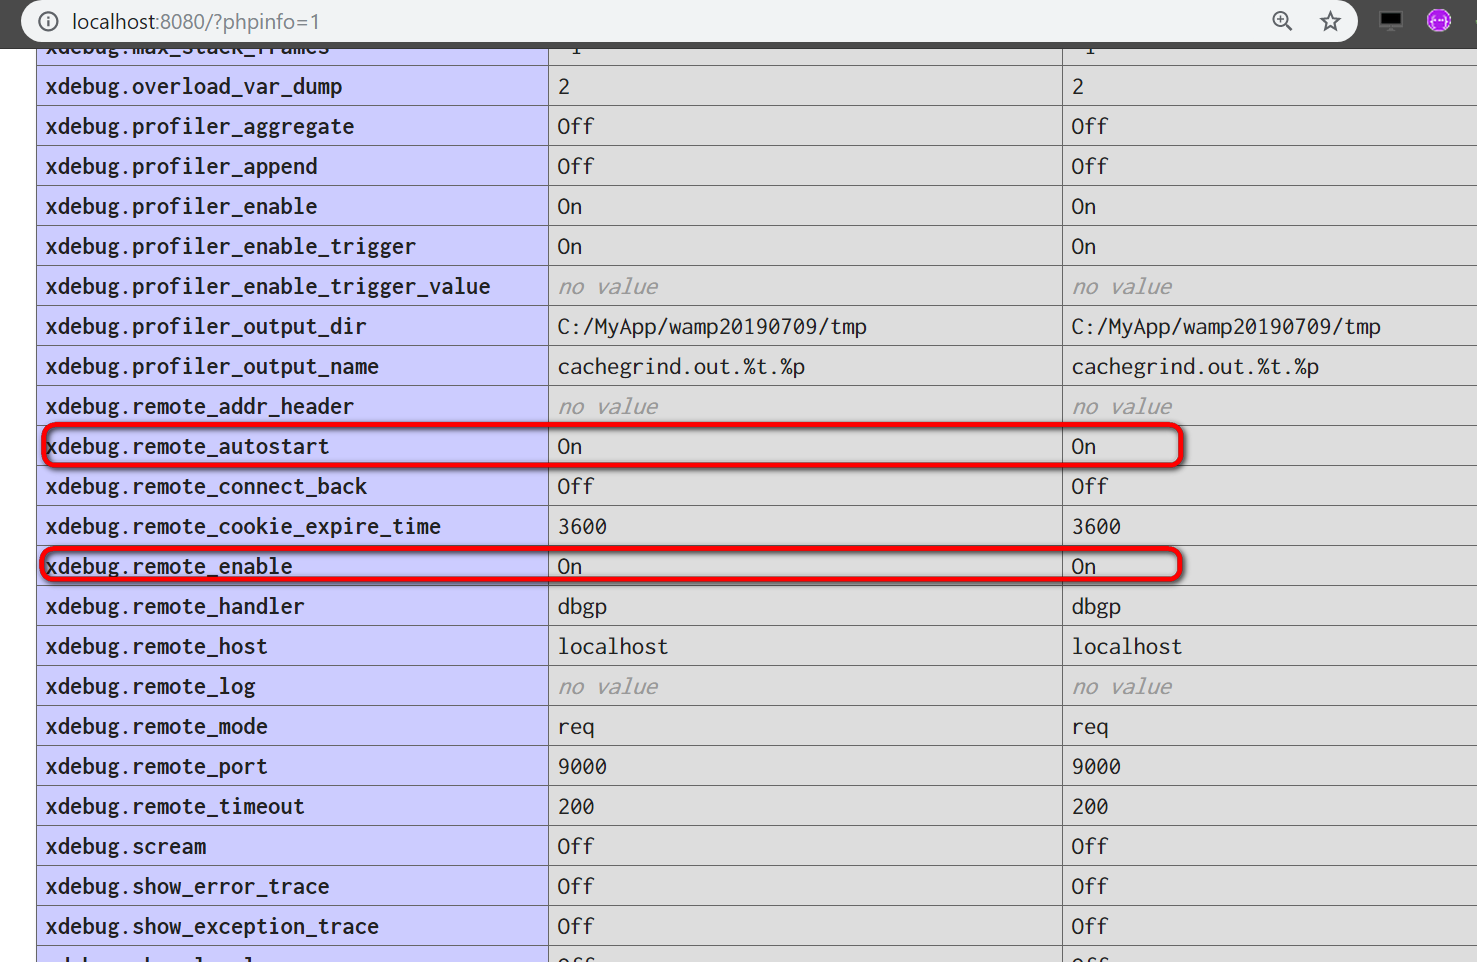
启动WAMP服务器,确保xdebug.remote_autostart, xdebug.remote_enable都为on:
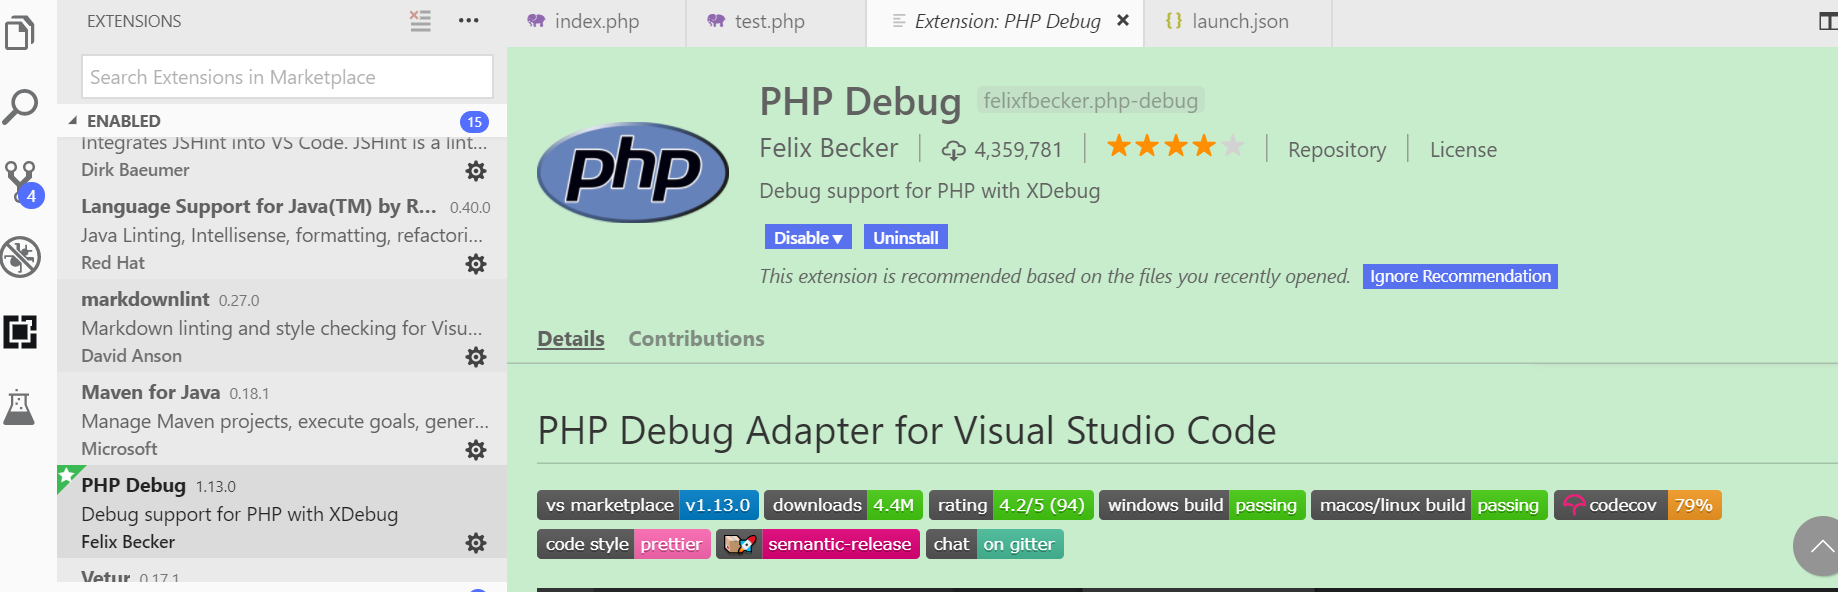
然后安装Visual Studio Code的扩展:PHP Debug
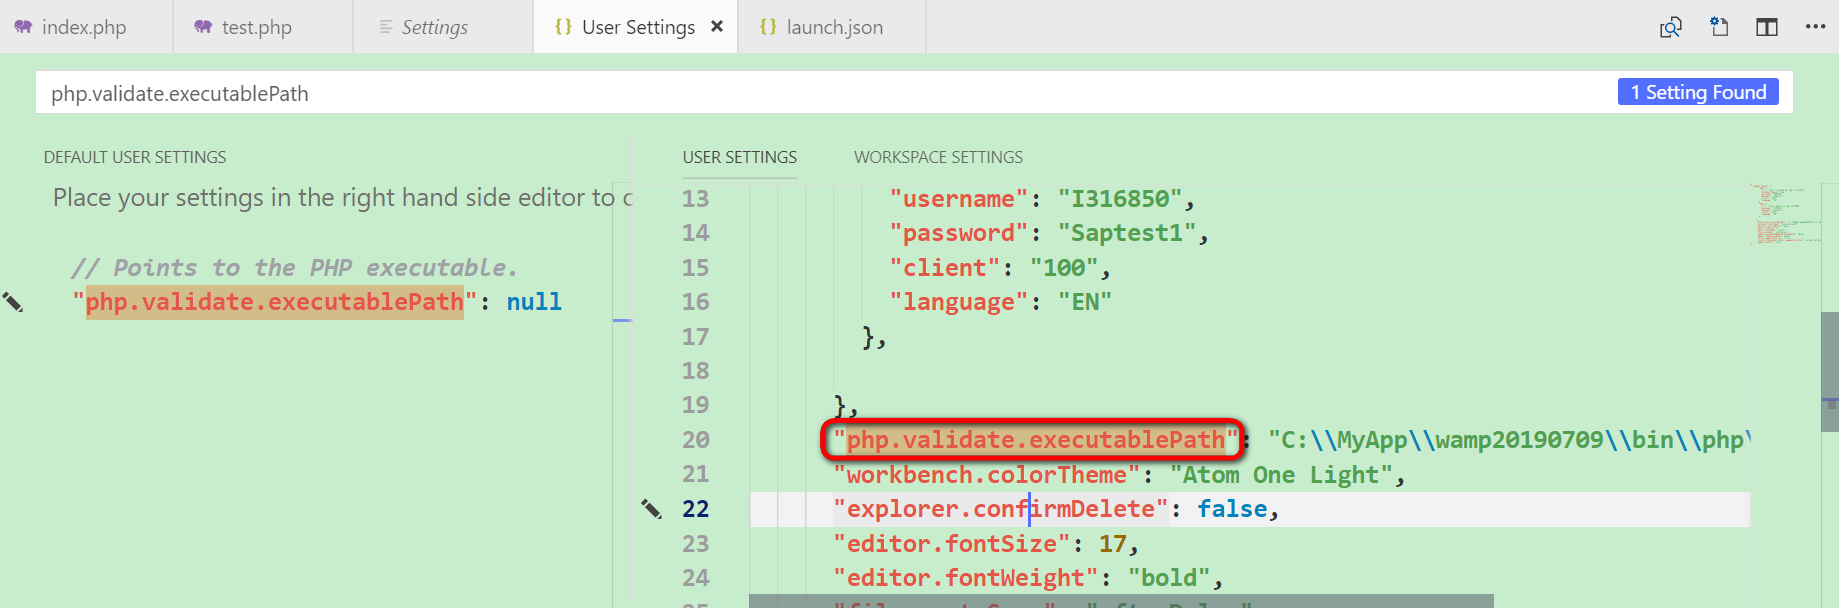
安装完毕后,File->Preferences->Settings:
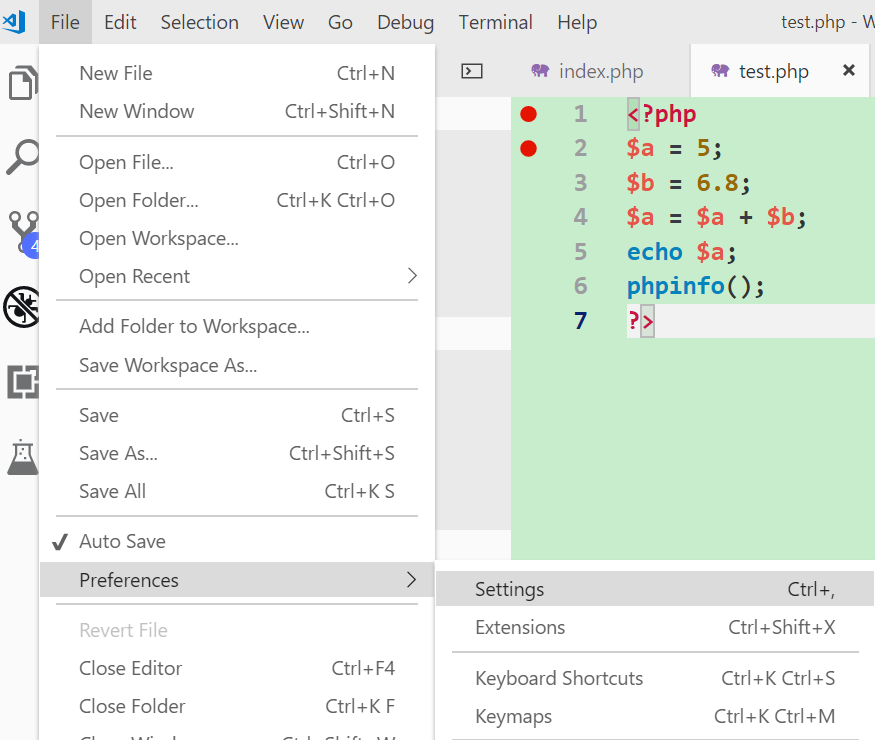
添加一条entry:php.validate.executablePath, 指向你本地的php.exe
创建一个PHP debug configuration,有两种方式选择:
Launch current open 和Listen for Xdebug:
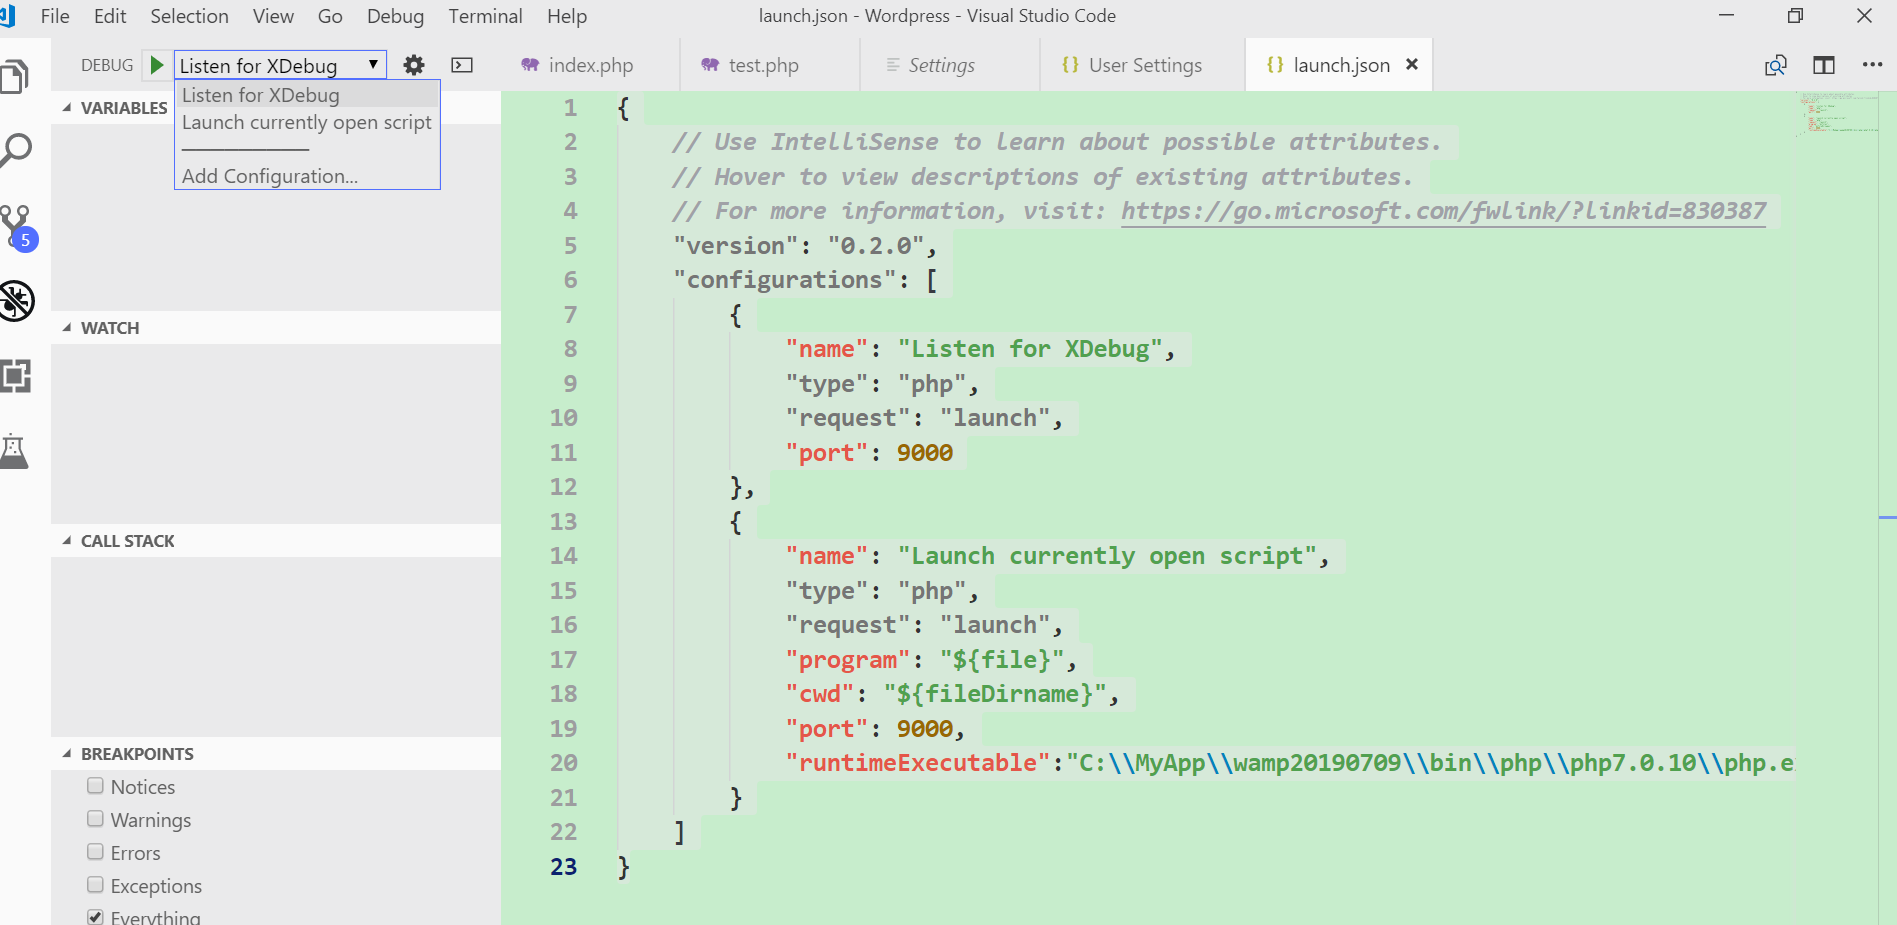
{ // Use IntelliSense to learn about possible attributes. // Hover to view de ions of existing attributes. // For more information, visit: https://go.microsoft.com/fw /? id=830387 "version": "0.2.0", "configurations": [ { "name": "Listen for XDebug", "type": "php", "request": "launch", "port": 9000 }, { "name": "Launch currently open ", "type": "php", "request": "launch", "program": "${file}", "cwd": "${fileDirname}", "port": 9000, "runtimeExecutable":"C:MyAppwamp20190709inphpphp7.0.10php.exe" } ]}前者调试PHP CLI应用比较方便,打开一个php文件,直接F5,断点即触发。
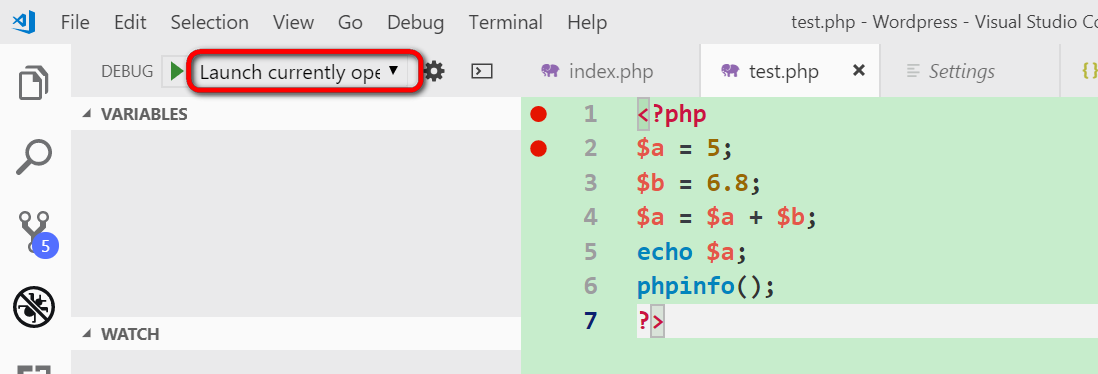
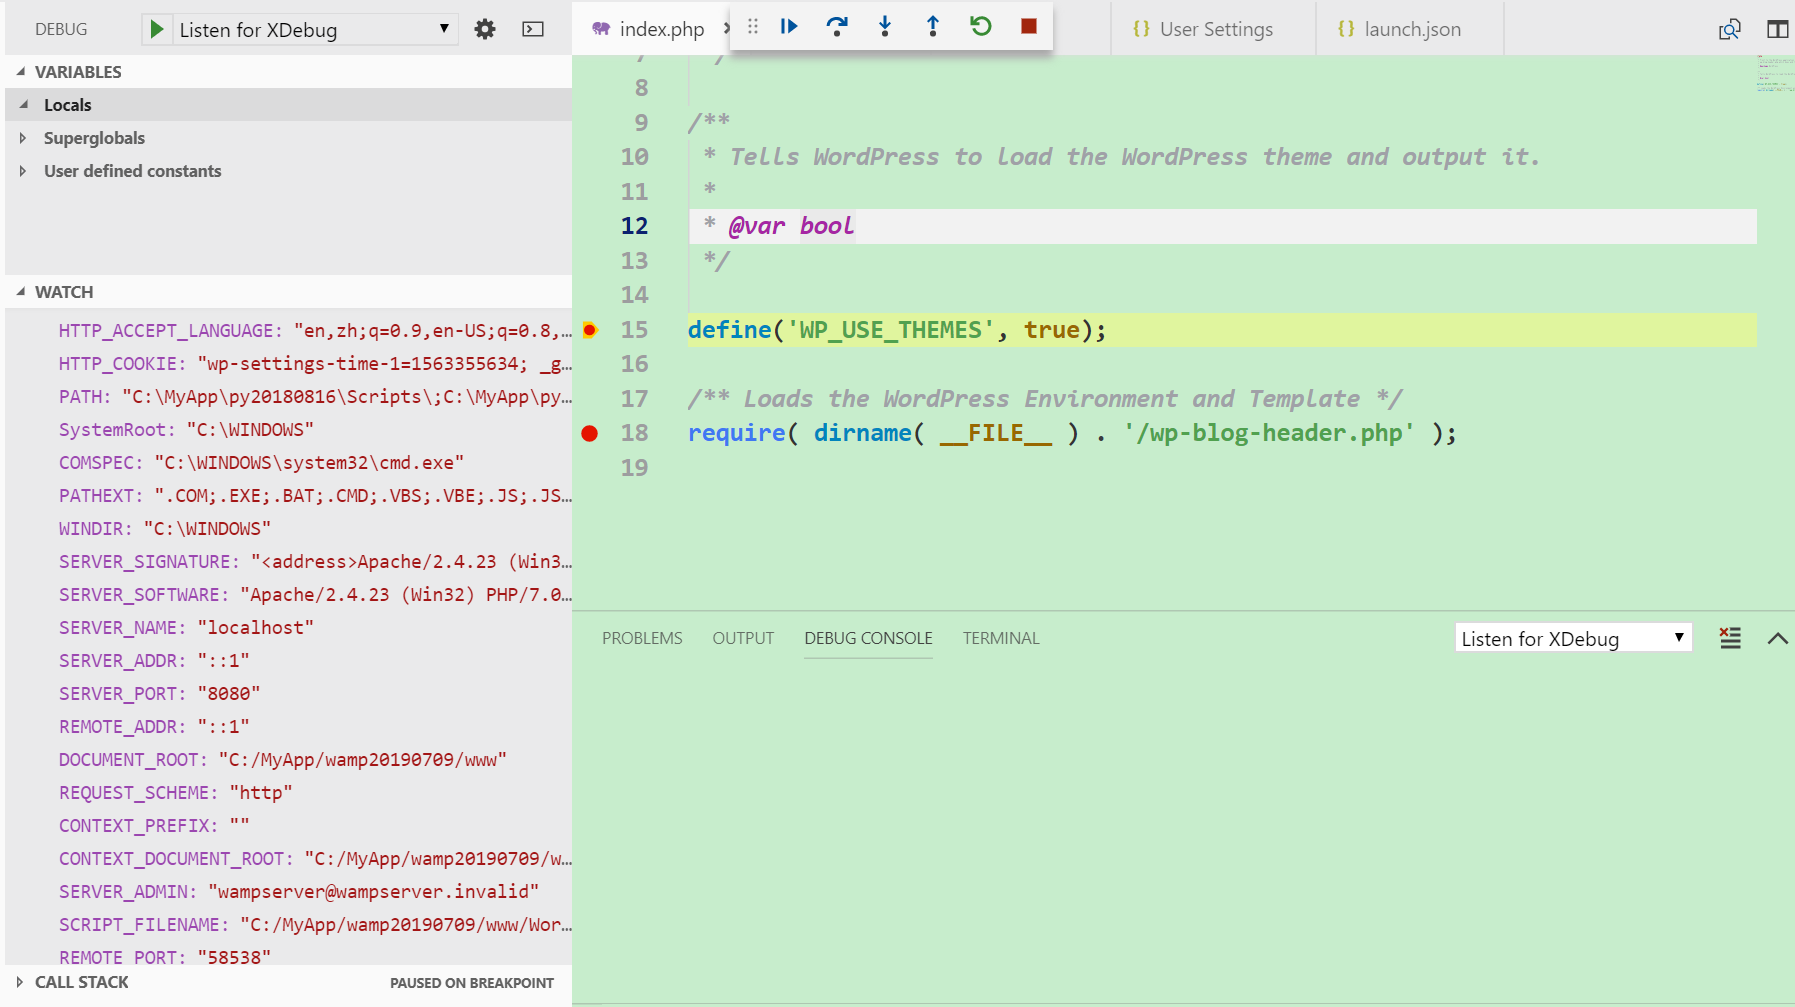
如果选择成Listen for XDebug,同样先F5启动调试进程,
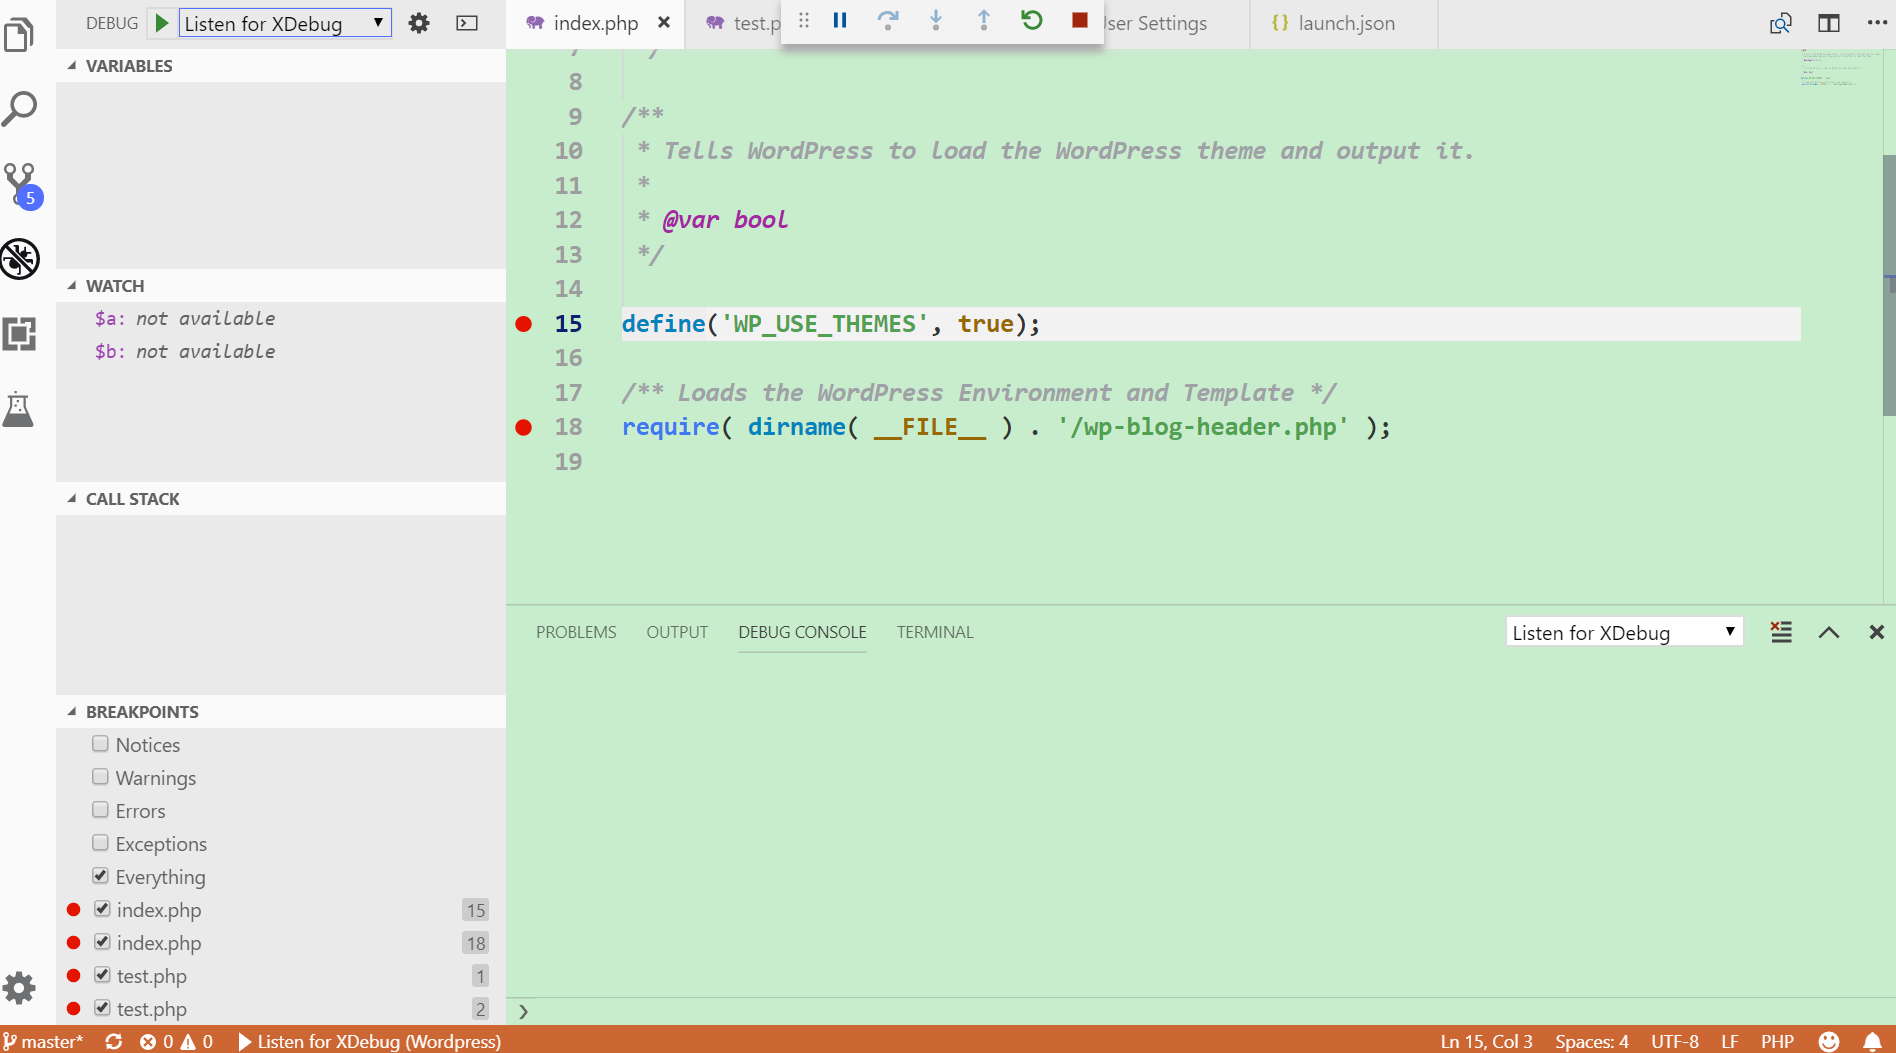
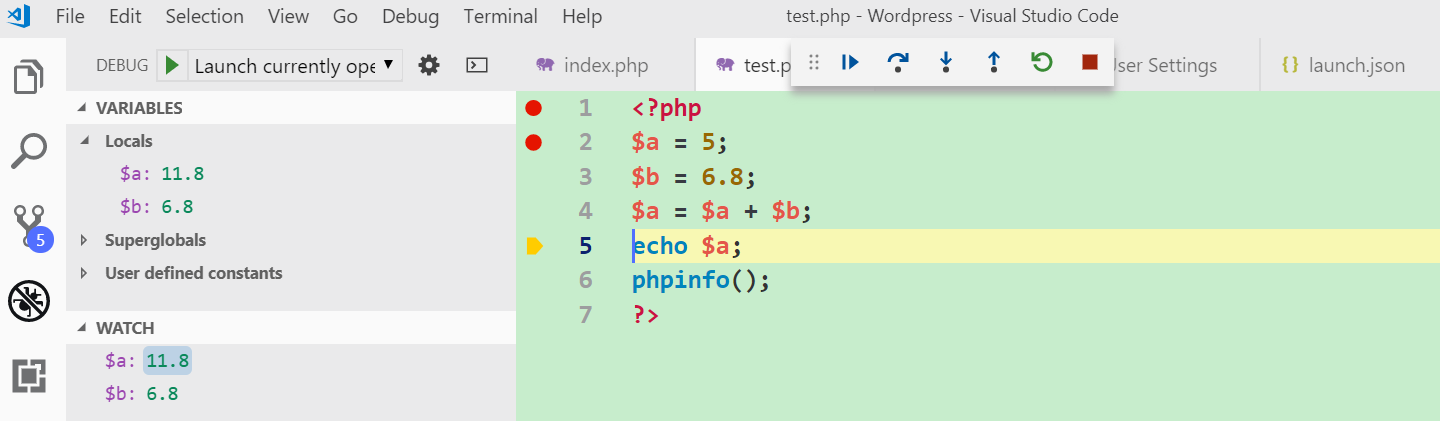
然后浏览器里访问待调试的PHP文件,Visual Studio Code的断点即触发,可以单步调试了:
本文来自云栖社区合作伙伴“汪子熙”,了解相关信息可以关注微信公众号"汪子熙"。
继续阅读与本文标签相同的文章
-
《2017中国开发者调查报告》重磅发布!这是开发者最好的时代
2026-05-23栏目: 教程
-
企业如何选择阿里云服务器
2026-05-23栏目: 教程
-
用户说体验 | 关于阿里百川HotFix你需要了解的一些细节
2026-05-23栏目: 教程
-
5亿次Web攻击 怎么防住的?
2026-05-23栏目: 教程
-
阿里的开源思想:与世界讨论中国的互联网技术与场景
2026-05-23栏目: 教程