
微软最近发布了最新的ASP.NET服务器端控件 <asp:chart />, 在ASP.NET 3.5 中可以使用这个控件在浏览器端显示炫目的图表。
- Download the free Microsoft Chart Controls
- Download the VS 2008 Tool Support for the Chart Controls
- Download the Microsoft Chart Controls Samples
- Download the Microsoft Chart Controls Documentation
- Visit the Microsoft Chart Control Forum
一旦安装了<asp:chart/>控件,就会在Toolbar的"Data"栏出现,也可以在ASP.NET页面中很容易的使用代码定义:

<asp:chart/>支持丰富的图表形式,including pie, area, range, point, circular, accumulation, data distribution, ajax interactive, doughnut, and more. 你可以在面板里直接输入数据或者使用数据绑定动态的显示。在运行的时候,这个控件在服务器端生成一个图片(比如一个PNG文件),客户端使用一个<img/> HTML元素来引用这个图片。这个服务器控件提供缓存这个图片的功能或者长期作为一个文件保存的功能,它在任何标准的ASP.NET页面都可以工作,不需要特殊软件的支持。
想要更好的理解这个控件,我推荐downloading the Microsoft Chart Controls Sample Project.
下面是几个抓图:
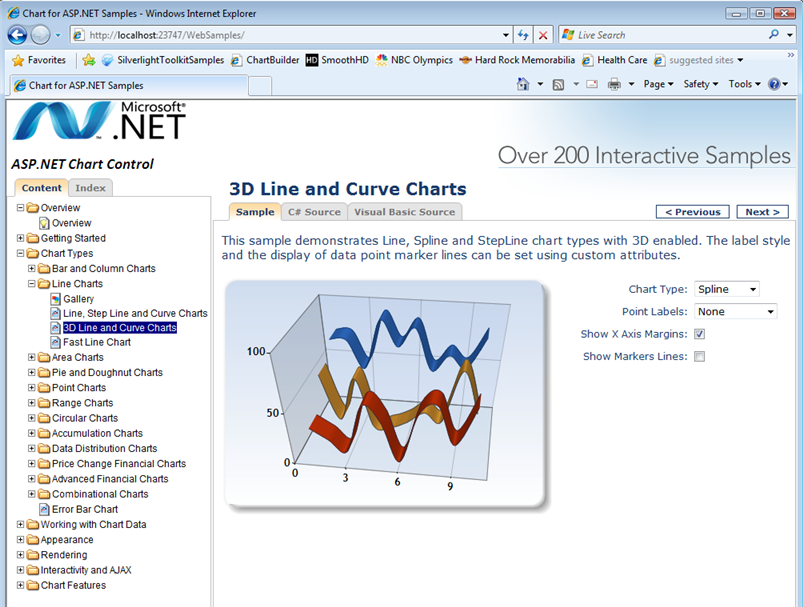
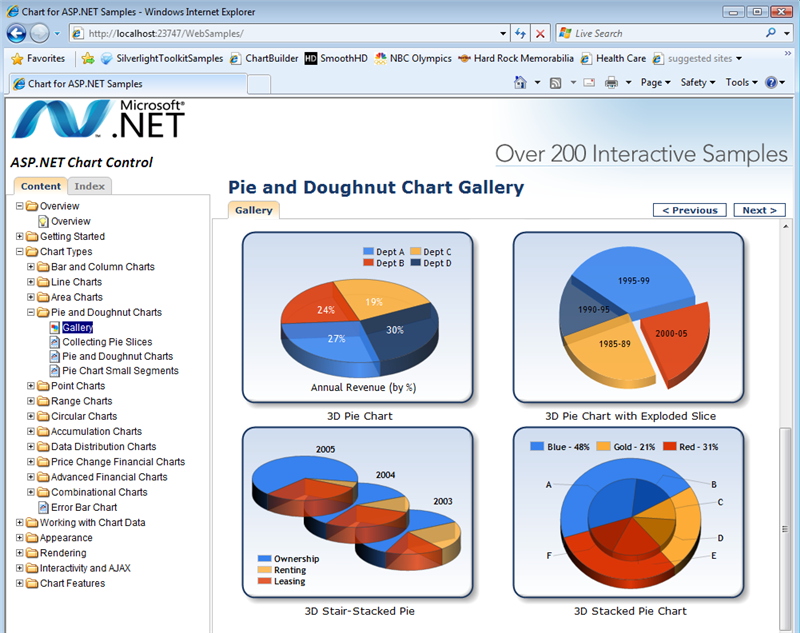
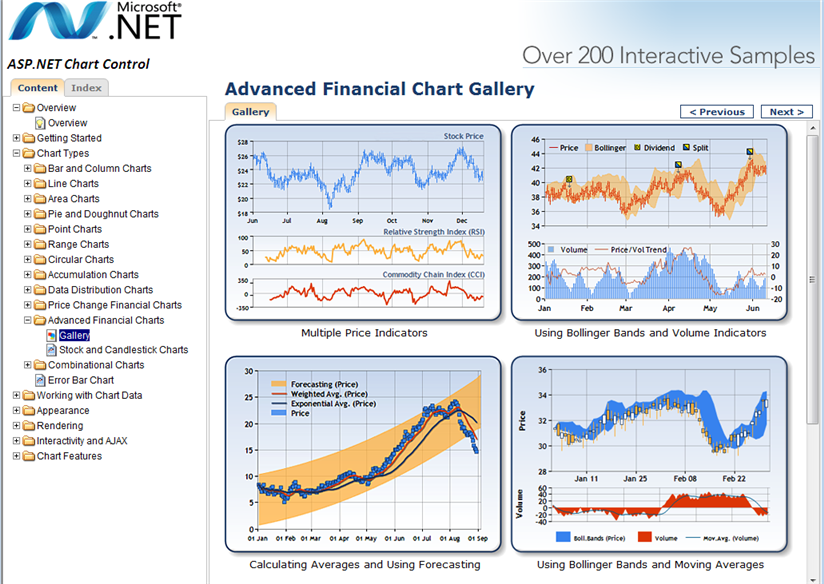
除了上面的一些示范,你可以下载Microsoft Chart Control Documentation 或者去Chart Controls Forum 讨论
继续阅读与本文标签相同的文章
-
给VMware Player 2.x增加Shared Folders
2026-05-25栏目: 教程
-
IE 6中负的margin值导致出界部分不显示问题的解决
2026-05-25栏目: 教程
-
ChinaMap:中国地图Flash版
2026-05-25栏目: 教程
-
DotNetNuke(DNN) 中查询所有管理员的SQL语句
2026-05-25栏目: 教程
-
Internet Explorer中Float DIV和Clear DIV之间奇怪间隙的Bug
2026-05-25栏目: 教程